On the Behavior of the RTT
1. Summary
This document is a short report on our preliminary research to understand the behavior of the round-trip time (rtt) between a source and a destination when the path between them traverses MPLS tunnels, middleboxes, or different access technologies at the vantage points. Additionally, we test a measurement methodology based on scamper and tracebox, implemented in the rttExplorer tool.
Unfortunately, this preliminary study has several limitations: few vantage points, and results that are hard to interpret, since each one requires a specific and exhaustive analysis that is difficult to automate.
These early, partial results suggest that there is no relation between the presence of technologies such as MPLS or middleboxes and the shape of the rtt distribution. On the other hand, we find that the rtt distribution differs from one ISP to another. It remains unclear whether this difference is due to the access technology of each ISP or to other factors. Additionally, our results corroborate previous work that found that the rtt seems to follow a stable distribution with a single component, and that the occasional appearance of a second component (i.e., a bimodal distribution) is related to changes or problems in the network along the path between the vantage point and the analyzed hop.
2. Introduction
This work started as an attempt to analyze the distribution of the rtt across different Internet hops. Since the rtt appears to follow a stable distribution, we tried to find out why this distribution sometimes has more than one modal component. Based on previous work, our a priori suspicion was that this second modal component could originate from some technology invisible to the IP topology, such as MPLS or middleboxes. Unfortunately, we did not find enough evidence to support this hypothesis.
In the remainder of this document, we describe some observations and results from this preliminary study. We first briefly describe the tool and the methodology used to measure the rtt of a given hop. We then describe the characteristics of the experiment, and finally we show the examples we consider most relevant among the observed results.
3. Dataset
To build the dataset, we measure the rtt to each of the hops discovered by a paris-traceroute-based probe. The following sections detail the characteristics of these measurements.
3.1. Tools
We obtained the data presented in this technical report with rttExplorer, a Python-based tool for measuring the rtt (round-trip time). These measurements target the different hops that a traceroute-like probe traverses between source and destination across the Internet. Specifically, rttExplorer uses scamper and tracebox to ensure that the packets of each probe avoid, as far as possible, the load balancing performed by Internet routers.
The methodology implemented by rttExplorer is simple:
First, we send a discovery probe towards the chosen destination. As a result, this probe reveals all hops along the path. At a regular interval (typically in the order of tens of minutes), a similar probe is sent again to confirm that the previously discovered path remains stable or to reveal a new one. This process repeats periodically for the whole exploration.
Next, once the hops between source and destination are known, we send a measurement probe. This second probe measures the rtt to each hop discovered by the latest discovery probe. The rttExplorer tool tries, as far as possible, to measure the rtt to all hops almost simultaneously. These measurements repeat periodically for all hops of each path at a regular interval (typically in the order of seconds) for the whole exploration.
Finally, the results are stored locally in JSON format and pushed to a MongoDB database, where the measurement results are stored permanently.
3.2. Selection of vantage points and destinations
Due to constraints in finding vantage points, this dataset only uses residential Internet connections from the following operators:
- Telecom: DOCSIS service (Fibertel)
- Telefónica: DSL service (Speedy)
- Personal: LTE service
We pick the destinations at random, without any specific criterion, while trying to place them in different geographic regions.
3.3. Probe details
We run explorations and measurements with either TCP or UDP probes. For each result shown in the following sections, we state the protocol used.
| Protocol | tcp/udp |
|---|---|
| Source port | random |
| Destination port | 443(tcp)/4444(udp) |
| Method | tcp-paris, udp-paris |
| Discovery interval | 10 min |
| Measurement interval | 1 sec |
3.4. Limitations of the experiment
- Few vantage points available.
- Results based on few experiments (three sources towards about ten destinations).
4. Results
The initial goal of the experiment was to understand, in as much detail as possible, the behavior of the rtt over Internet links in different scenarios, for instance, links that traverse middleboxes, MPLS tunnels, or different underlying technologies (e.g., different access or transport networks). Unfortunately, given the limited number of vantage points in this phase, we could not evaluate all scenarios, nor run enough tests to reach conclusive results.
Nevertheless, our preliminary results show that the behavior of the rtt is not affected by the presence of middleboxes (MB) or MPLS tunnels. We also confirm that the rtt follows a stable distribution, as discussed in previous work. This distribution typically has a single modal component, although bimodal stable distributions occasionally appear.
The appearance of additional modal components does not seem to be related to the presence of MPLS or MB. Instead, it seems to be related to:
Path changes that are invisible in terms of hops: i.e., we observe that the rtt changes even when both the hops to the destination (same route) and the number of hops from the destination back to the vantage point (
reply_ttl) remain the same.Network load, which seems to be related to a second modal component in the distribution. This is especially noticeable when we analyze long measurements (in the order of several hours).
The following sections show the most representative results of the analyzed cases.
4.1. Stable distribution with a single modal component.
4.1.1. rtt variation driven by the ISP’s peak hours.
| parameter | value |
|---|---|
| Vantage point ISP | Telecom |
| Vantage point access tech. | DOCSIS |
| Source IP | 192.168.0.126 |
| Destination IP | 187.102.77.237 |
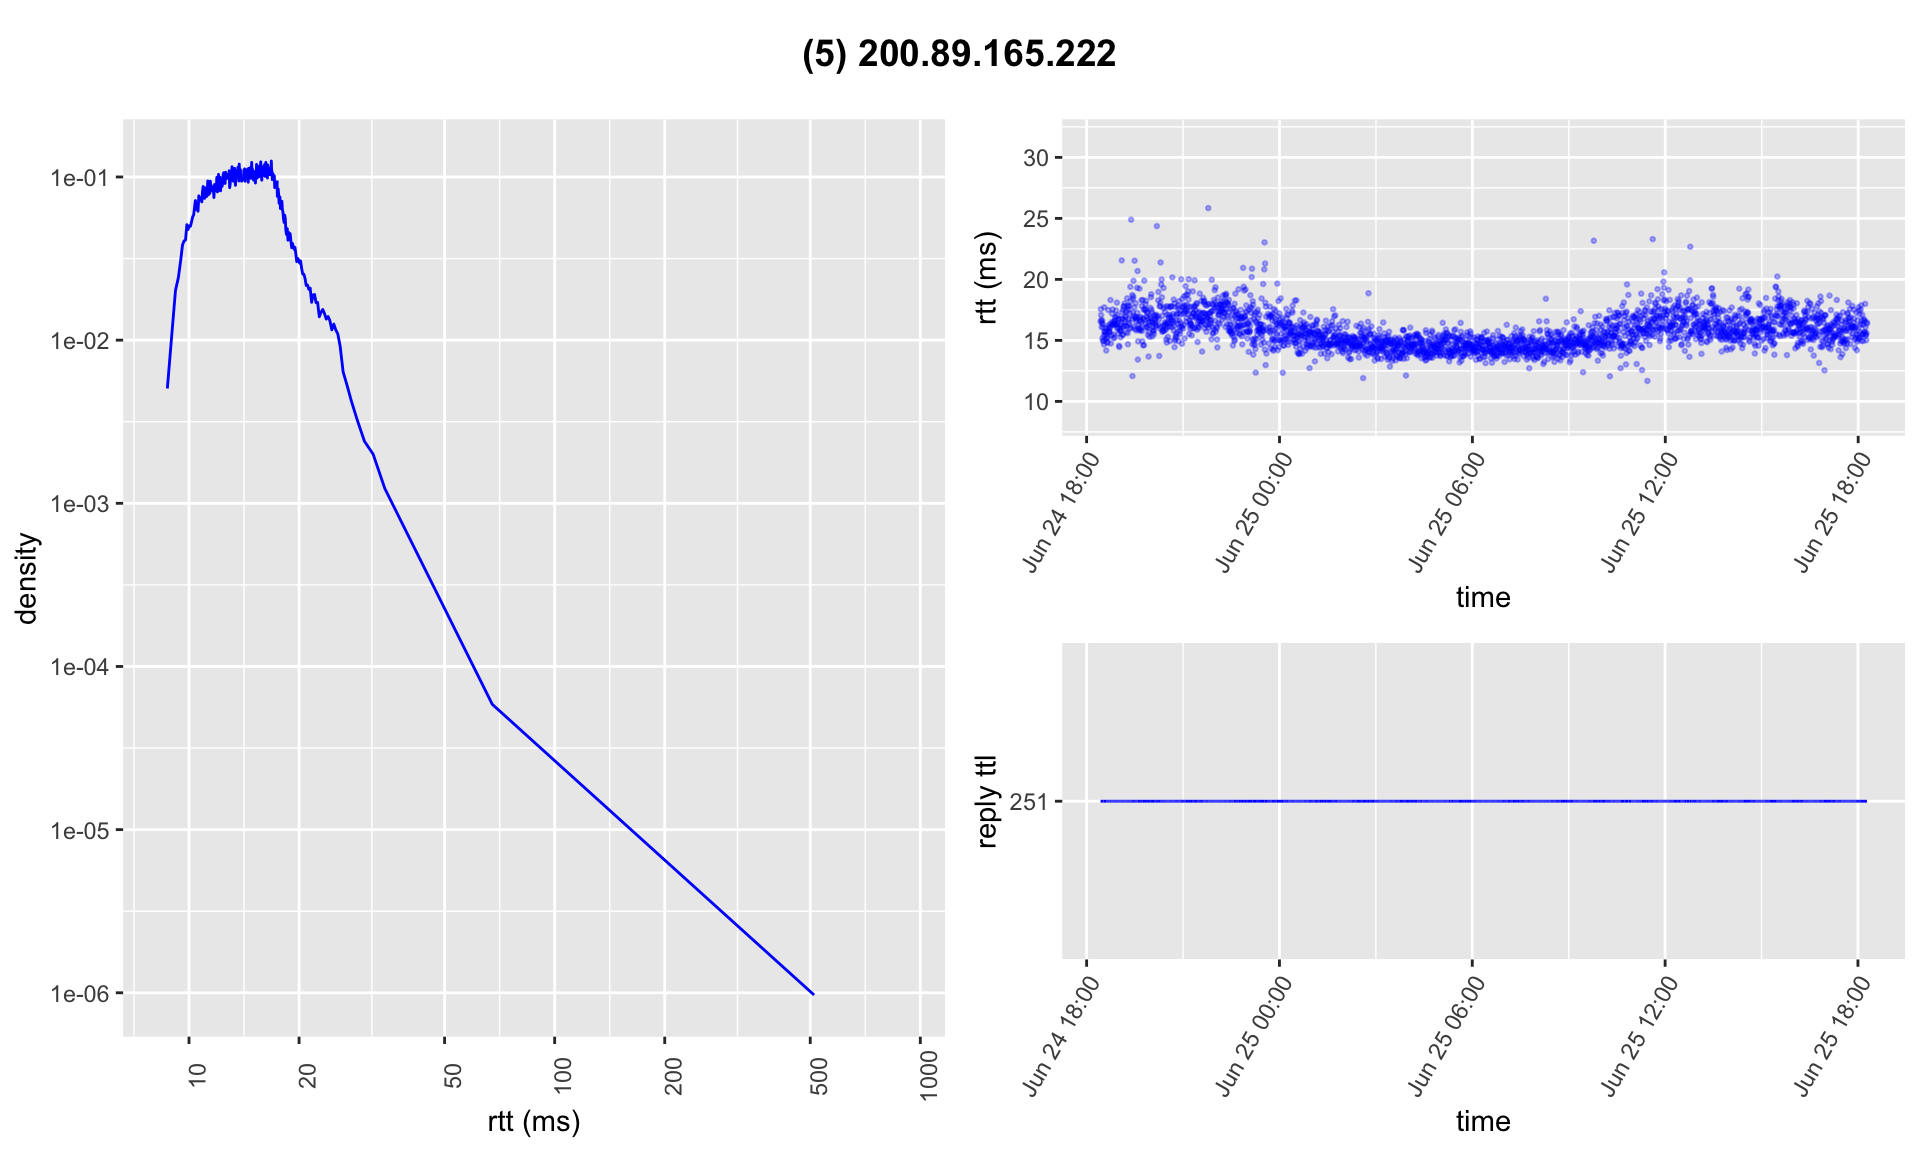
| Hop IP | 200.89.165.222 |
| Initial TTL | 5 |
| Hop AS | AS10318 (Telecom) |

The rtt distribution has a single modal component. We observe neither MPLS tunnels nor middleboxes along the path.
Additionally, we observe that the rtt varies over time following the peak hours of the access network.
4.1.2. rtt variation caused by network outages.
| parameter | value |
|---|---|
| Vantage point ISP | Telefónica |
| Vantage point access tech. | DSL |
| Source IP | 192.168.1.35 |
| Destination IP | 185.45.165.14 |
| Hop IP | 200.51.208.166 |
| Initial TTL | 4 |
| Hop AS | AS22927 (Telefónica) |
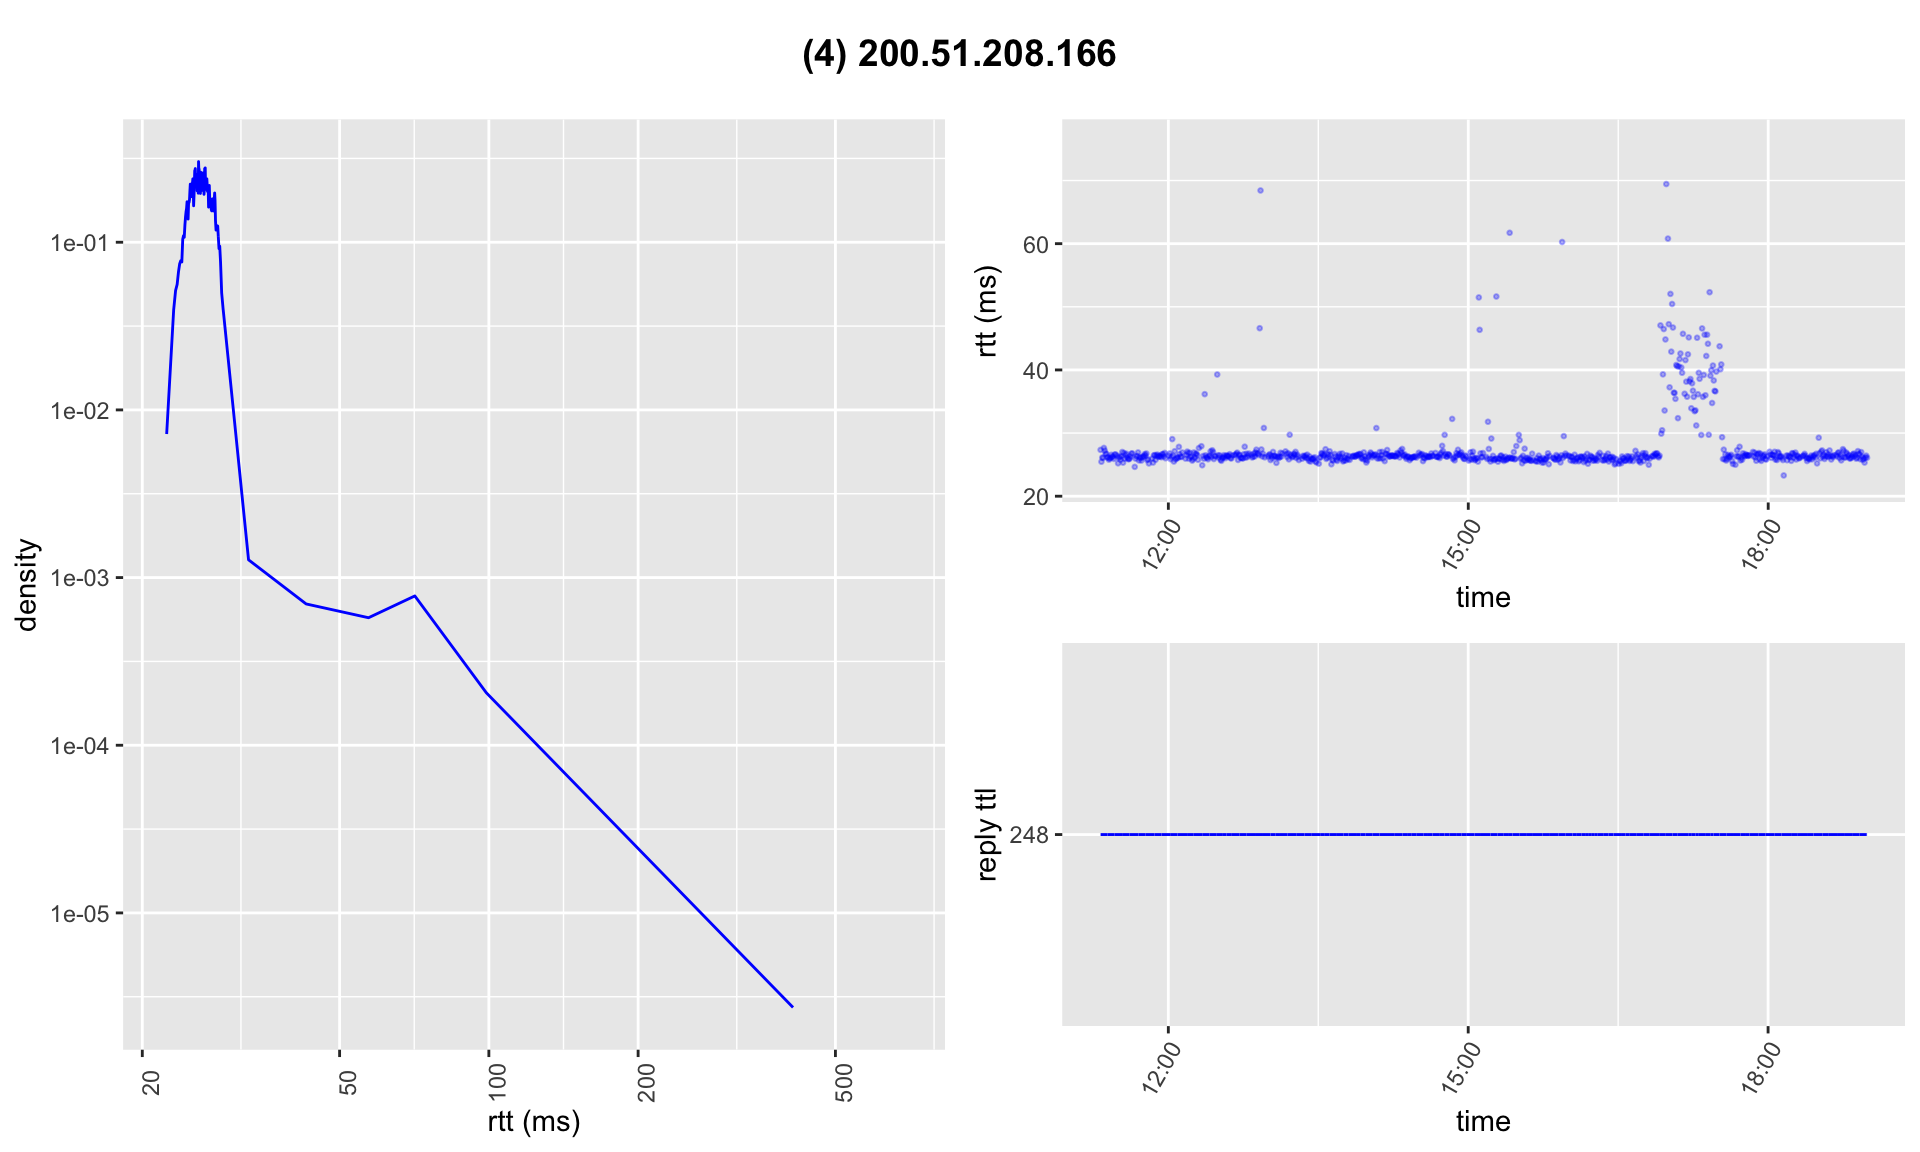
The rtt distribution has a single modal component. The analyzed hop is the ingress LSR of an MPLS tunnel. We observe no middleboxes along the path.
Additionally, we observe that the modal component of the rtt does not change over time, despite short outage intervals detected during the monitoring.
4.2. Bimodal stable distribution.
4.2.1. rtt variation caused by slight, long-lasting changes.
| parameter | value |
|---|---|
| Vantage point ISP | Telefónica |
| Vantage point access tech. | DSL |
| Source IP | 192.168.1.35 |
| Destination IP | 185.45.165.14 |
| Hop IP | 201.179.128.1 |
| Initial TTL | 2 |
| Hop AS | AS22927 (Telefónica) |
 The rtt distribution has two modal components, caused by slight changes in the rtt over long intervals. These changes are mainly visible at 12:15 and 15:00. However, if we plot the resulting distribution over shorter time intervals, we observe only one stable component.
Along the path to the analyzed hop, we find neither MPLS tunnels nor middleboxes.
4.2.2. rtt variation caused by abrupt, long-lasting changes.
| parameter | value |
|---|---|
| Vantage point ISP | Telefónica |
| Vantage point access tech. | DSL |
| Source IP | 192.168.1.35 |
| Destination IP | 187.49.218.114 |
| Hop IP | 187.49.218.114 |
| Initial TTL | 19 |
| Hop AS | AS28154 (Telecom) |
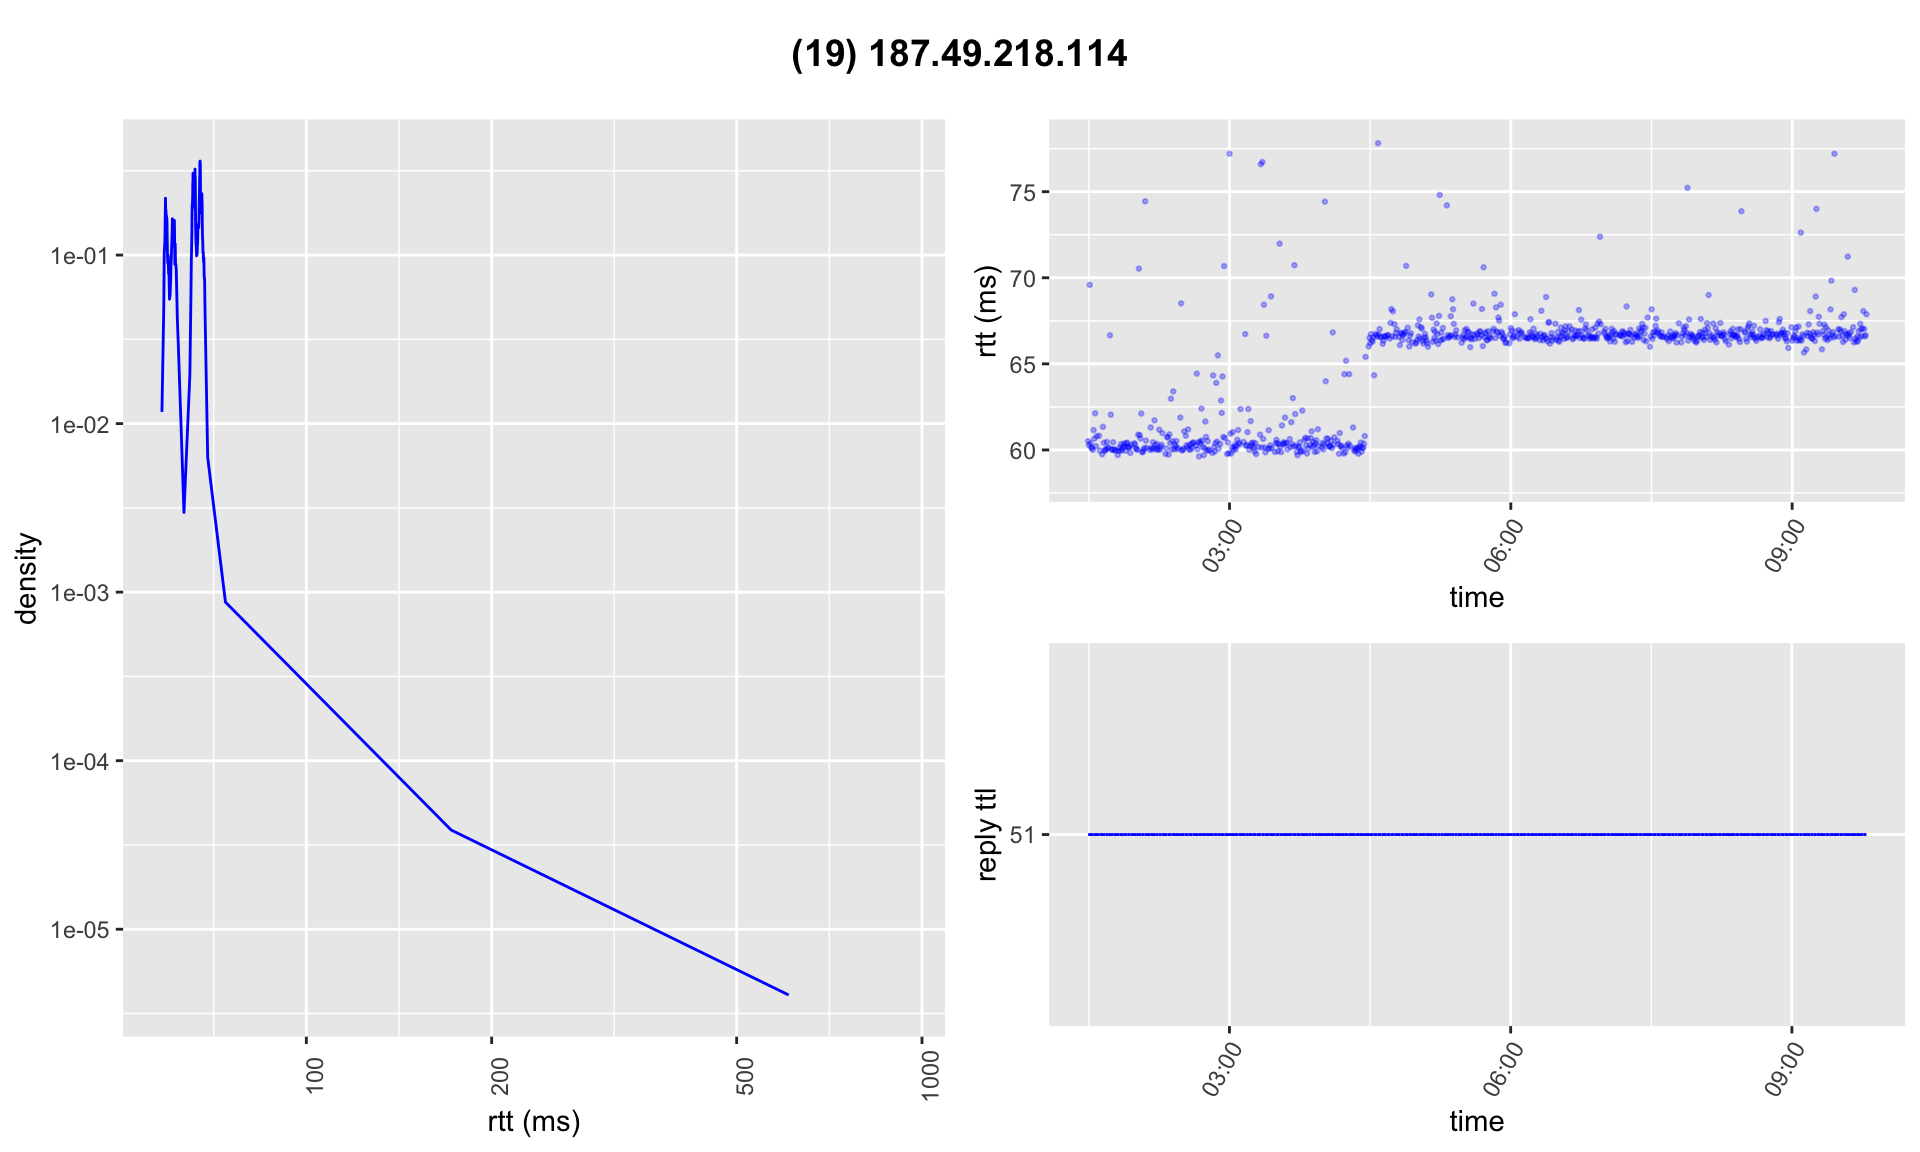
The rtt distribution has two modal components, caused by abrupt changes in the rtt over long intervals. The change is mainly visible at 04:30. However, if we split the data at 04:30 and plot each part, we observe only one stable component in each distribution.
Along the path, we discover MPLS tunnels before reaching the analyzed hop, and we record no middleboxes. However, the LSRs (MPLS routers) at previous hops do not influence the change in the rtt behavior.
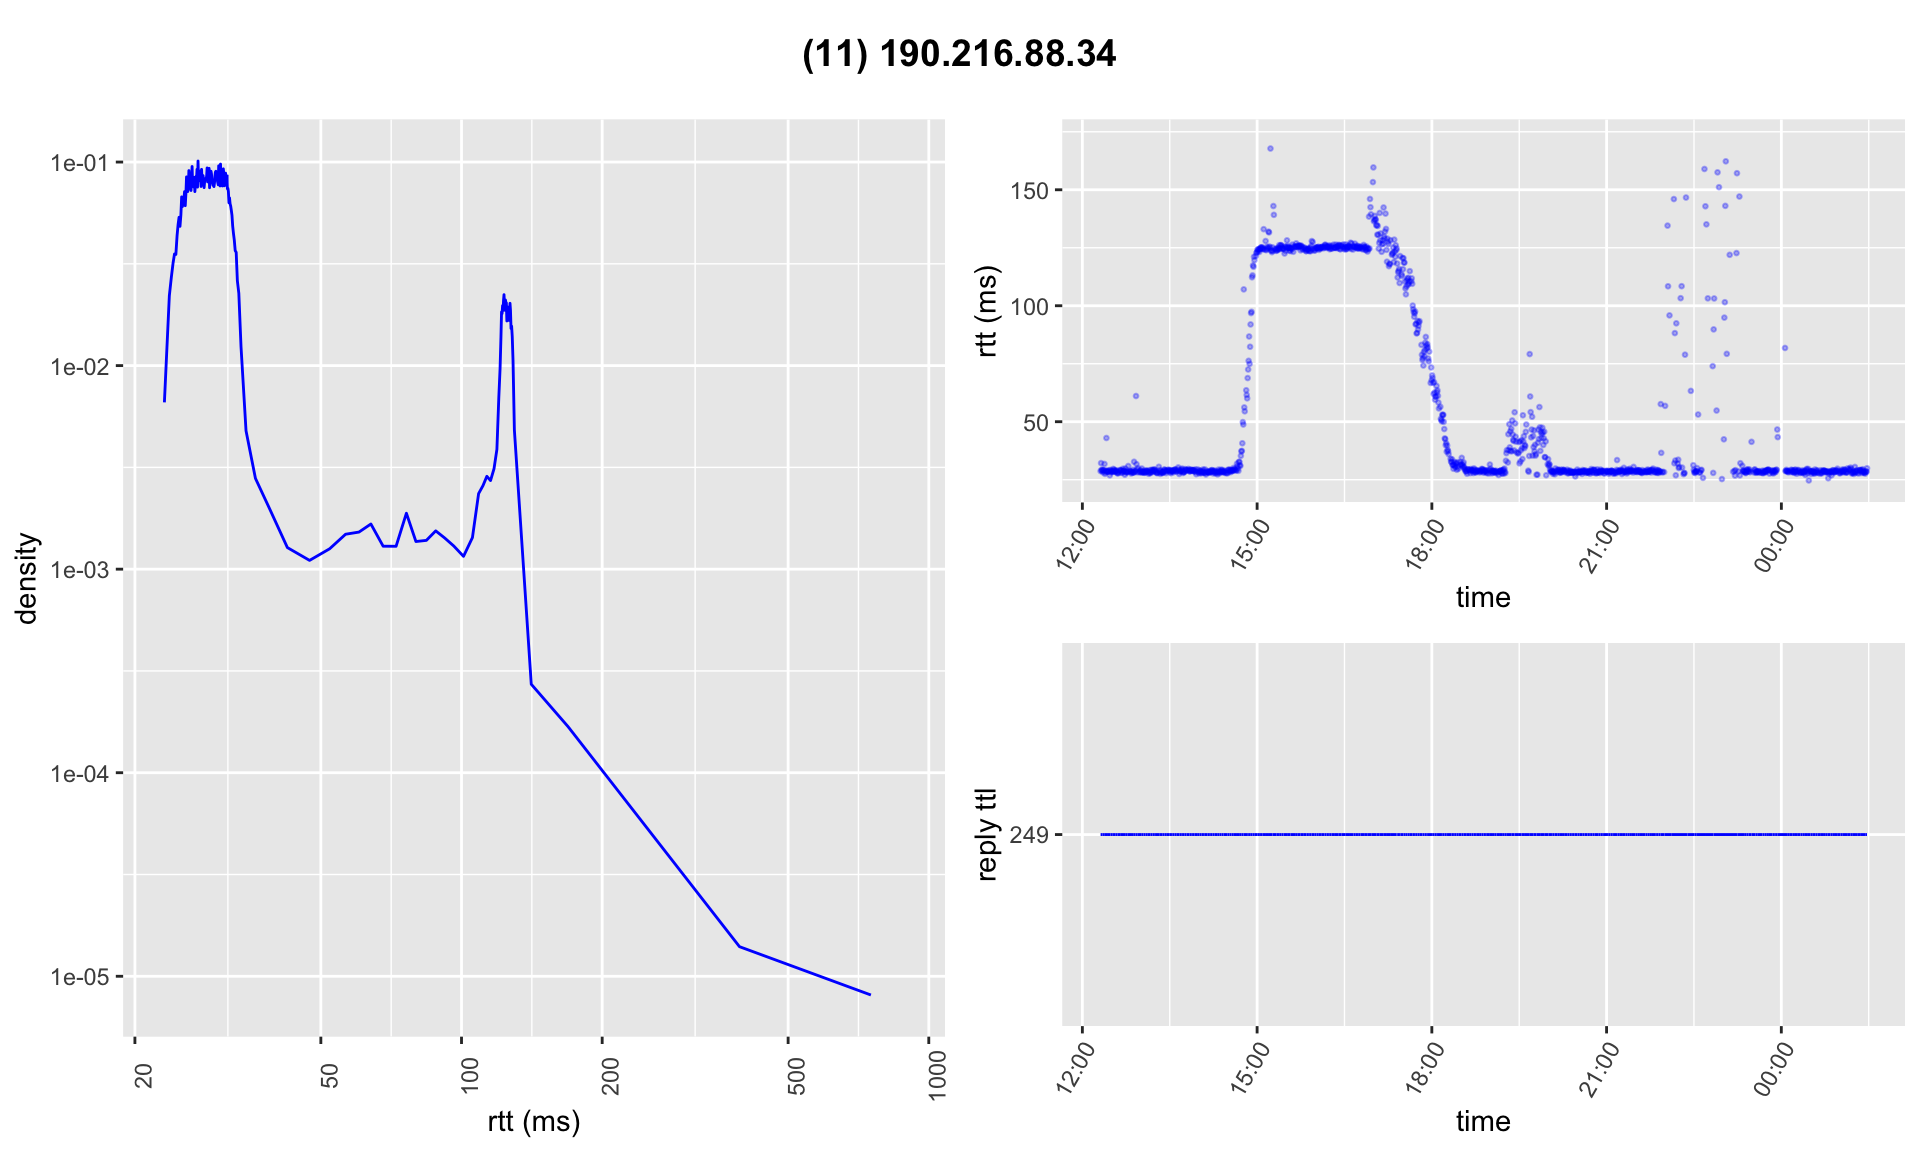
The abrupt change of the rtt in the time domain could mean that the probes changed route. However, we find no evidence of this in the traceroute path (hops, probe_ttl and reply_ttl). We also observe this behavior in the next example (hop 190.216.88.34).
| parameter | value |
|---|---|
| Vantage point ISP | Telefónica |
| Vantage point access tech. | DSL |
| Source IP | 192.168.1.35 |
| Destination IP | 181.30.134.68 |
| Hop IP | 190.216.88.34 |
| Initial TTL | 11 |
| Hop AS | AS4323 (Level 3 AR) |
4.2.3. rtt variation caused by abrupt, short changes.
| parameter | value |
|---|---|
| Vantage point ISP | Telecom |
| Vantage point access tech. | DOCSIS |
| Source IP | 192.168.0.126 |
| Destination IP | 198.45.49.161 |
| Hop IP | 200.89.165.222 |
| Initial TTL | 6 |
| Hop AS | AS10318 (Telecom) |
 The rtt distribution has two modal components, caused by slight changes in the rtt over a short time interval. The change is mainly visible just before 22:30.
The analyzed hop is the ingress LSR of an MPLS tunnel. We observe no middleboxes along the path.
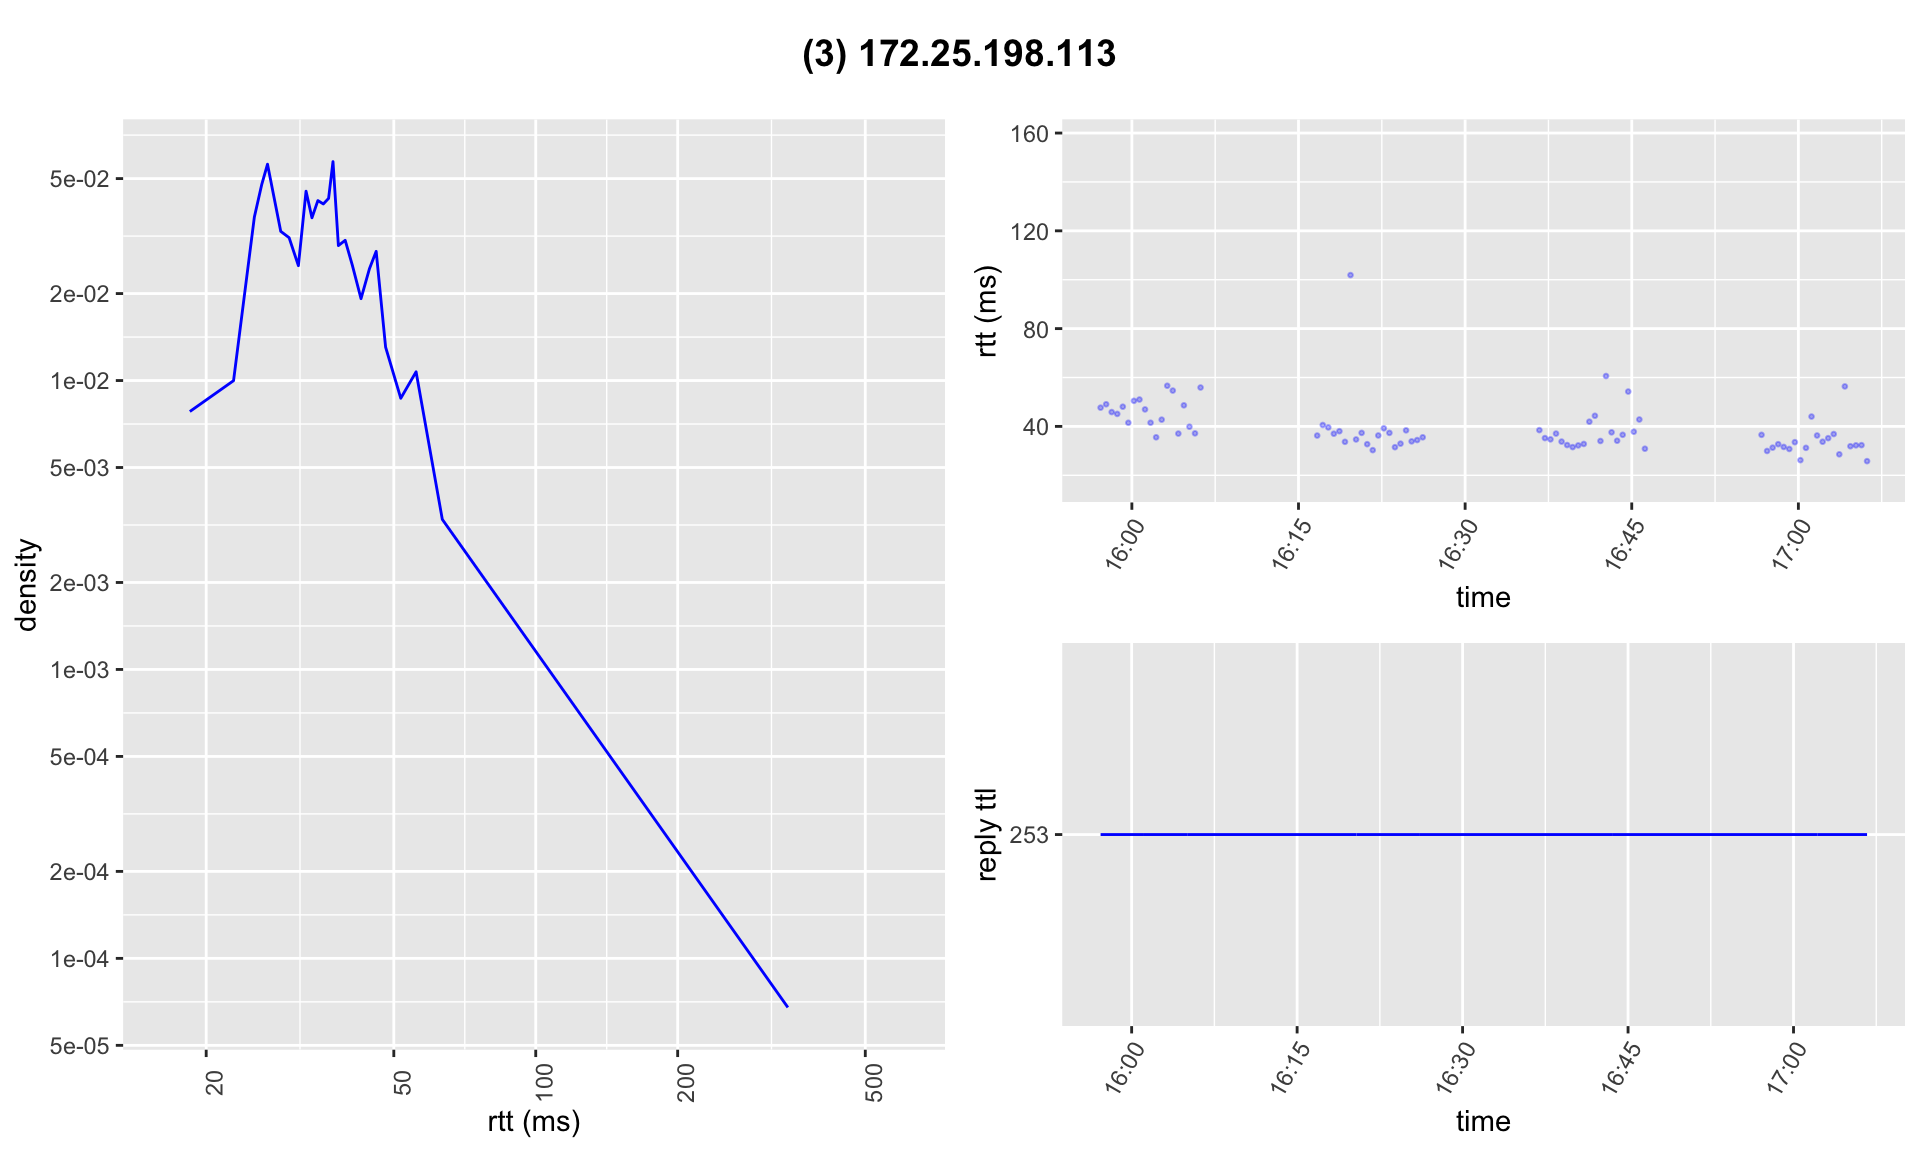
In this case, the slight change of the rtt in the time domain could coincide with congestion in the ISP network.
4.3. rtt variation by ISP
Unfortunately, we do not have enough vantage points to understand why the behavior of the rtt varies from one ISP to another. Still, it is worth highlighting the difference in the characteristics of the stable distribution when we analyze results from different ISPs. Below, we show three representative plots, one per ISP.
Interestingly, measurements from Telecom show larger variations over time, while measurements from Telefónica appear flatter. The following figures show this behavior.
Personal (LTE)
Telecom (DOCSIS)
Telefónica (DSL)

5. Conclusions
- Preliminarily, the presence of MPLS tunnels or middleboxes does not produce any particular behavior in the rtt distribution.
- The second modal component of the stable distribution seems to be related to changes in the network rather than to an intrinsic property of the rtt distribution. That is, the bimodal distribution would only appear when the rtt is measured over a long enough time (in the order of several hours), which increases the probability of some change in the network behavior.
6. Future work
- Replicate the experiments presented in this preliminary report with more vantage points.
- Study whether the characteristics of the stable distribution reveal the underlying network technology, for instance, the type of access network in use (LTE, DOCSIS, DSL, etc.).
- It remains unclear which phenomena cause the rtt to change abruptly even when there is no other sign of a path change. This is likely due to technologies invisible to the IP topology (MPLS, Ethernet, transport technologies, etc.). Explaining these rtt variations would be worthwhile; we could also study whether abrupt rtt changes allow us to accurately infer route changes along a path.